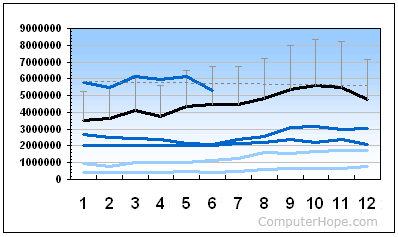
Line chart
Updated: 10/11/2017 by Computer Hope
Alternatively called a line graph, a line chart is a graphic representation of data that is plotted using several lines. Line charts display lines going across the chart horizontally, with the values axis displayed on the left side of the chart. The picture below is an example of a line chart showing unique visitors to Computer Hope.

As shown in this example, you can see the increases and decreases each year over different years.
